QuoteWizard
Project deployment time slashed from months to weeks with Tableau Server On-Demand Analytics.

Project deployment time slashed from months to weeks with Tableau Server On-Demand Analytics.
Project involved spinning up operational reporting for 4 new QuoteWizard products. Prior reporting had been mostly based in a home-built analytics system and compiled by product managers in excel for performance tracking and management.
At the end of the project we had installed a locally-hosted instance of Tableau Server and provided in depth dashboards for all four products. In one notable instance (detailed below), visualization allowed the business owner to identify a major problem area and rapidly scale revenues as a result.
As a part of their 2015 strategic growth initiatives, QuoteWizard identified four new product lines to grow as new businesses to supplement their already mature Auto Insurance lead program.
Quotewizard faced challenges in rolling out reporting for these products. Development resources were largely tasked away from reporting and towards operational requirements, and analytics and BI resources were focused on growing the existing Business.
Having worked with their business extensively in the past, they reached out to me to help deploy actionable reporting.
After an initial exploratory period, I proposed that the reporting needs be met through deploying a Tableau Server instance and providing the product owners with logins to their reports on Tableau Server.
My first step was to interview each of the business owners to understand their reporting needs and current report usage. Interviews were conducted in person and over email. In each case I found large areas of opportunity to streamline their workflow and improve their visibility into their business units.
My next step was to build data source and extract structures for their Tableau Server. I created and deployed 11 separate data source extracts that met the data needs for their reports. The data extracts were built flat to take advantage of Tableau Server’s optimized Data Engine while allowing maximum flexibility for further reporting requirements.
Using the direction from the interviews and the new data structure I was able to rapidly deploy the four dashboards. Before final deployment I met with the stakeholders again and reviewed the reports for accuracy and usability.
QuoteWizard was able to deploy their reporting needs well ahead of internal schedule, to a high degree of satisfaction for both stakeholders and management.
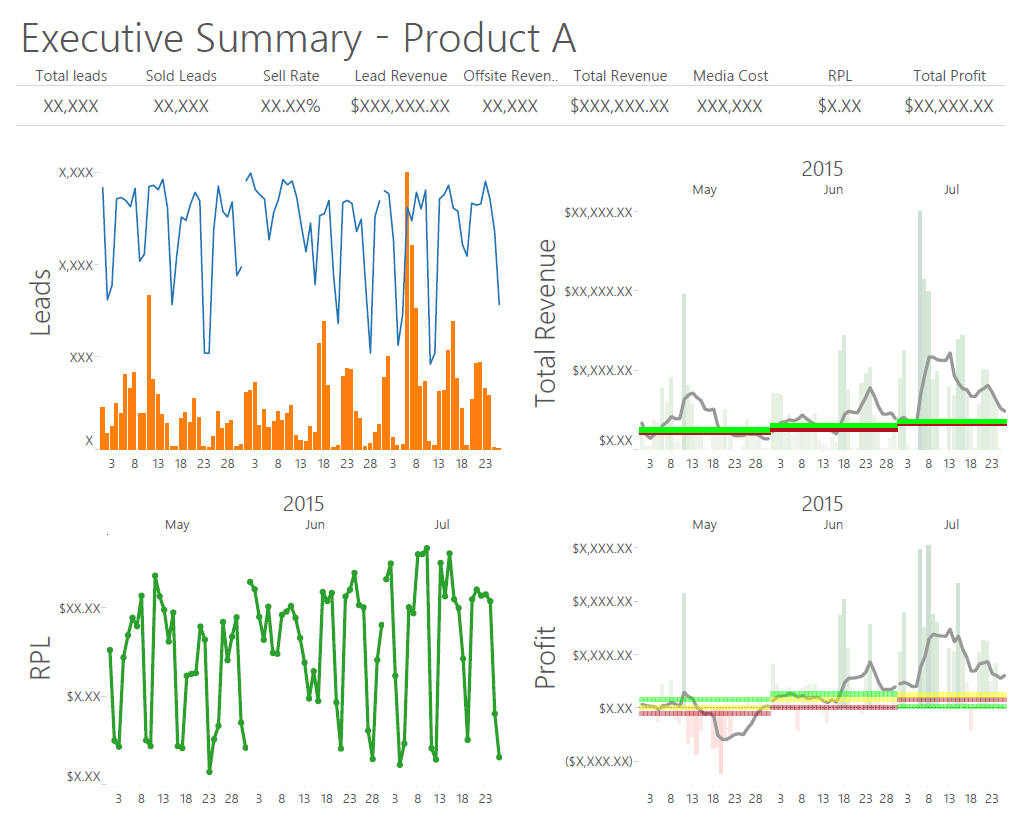
There were also significant revenue gains. For one product visualization of lead sources helped identify a major gap in lead traffic. Repairing that gap resulted in a substantial0 increase in overall revenue.
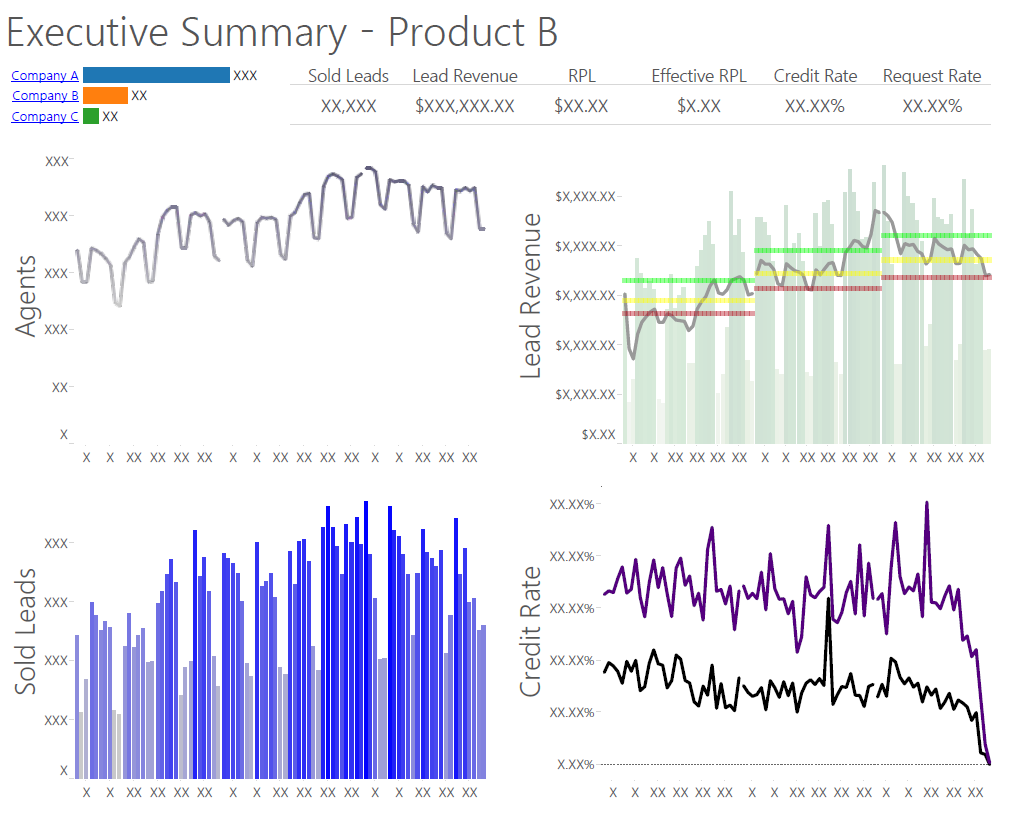
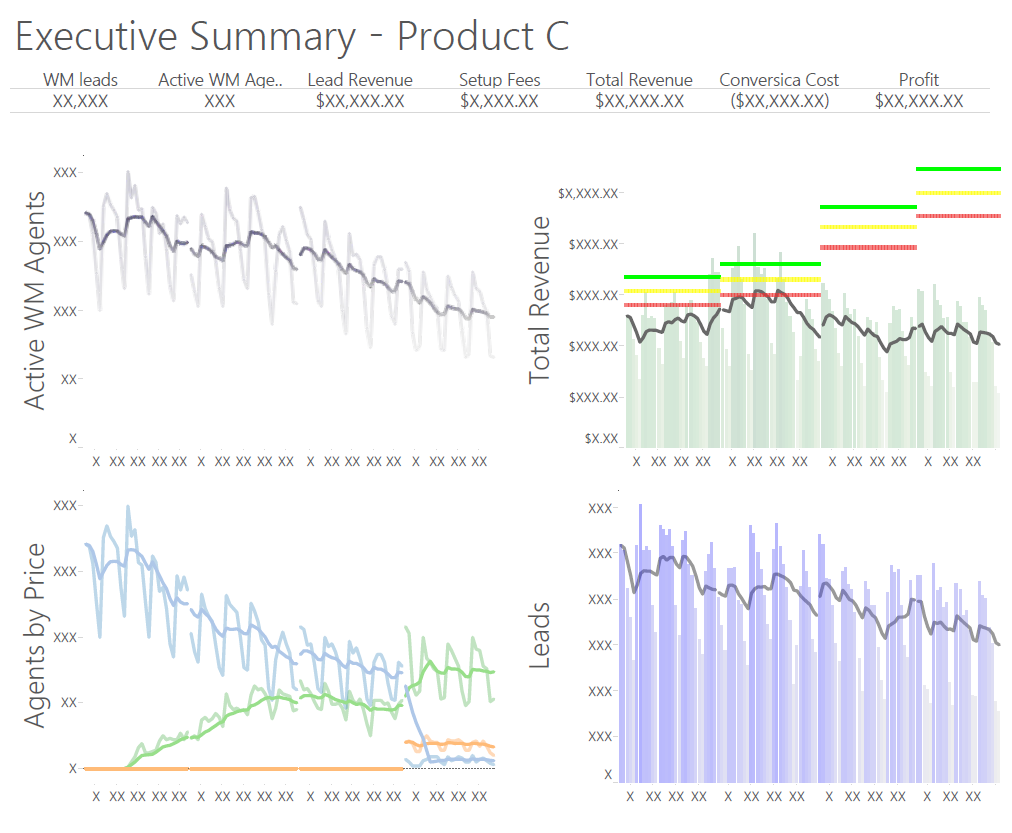
Reporting is highlight below, with details removed to protect client confidentiality.