Jason Wilson
When I gather, organize, and interpret data, I’m crafting the biography of a company. My data visualizations provide the outline, and my interpretations and explanations are the narrative.
While Director of Analytics at QuoteWizard, my primary objective was to gather my team’s findings and communicate that information clearly to our senior management team. Success meant arming our executives with the clearest and most relevant information. I now bring that experience to each client I work with.

My process for success
- Acquire rock-solid confidence in the data. Understand the complexities of the dataset and the business processes underlying it.
- Distill that information into visualizations that just make sense. When the visualization is right it will instantly “click” with the observer, and they will start pulling it out to gather insight.
- Review the visualization with the client, answer all questions about assumptions and conclusions, and guide them through the salient parts of the visualization.
- Help the client to drive action.
My products

Business Intelligence Oracle
You have a pressing business question, and you believe the answer is hidden somewhere in your databases. Open your data to me, tell me your story, and ask.
- You will receive a presentation of my findings generated in Tableau, an overview of my methodology, and any data sets I generated.
- I will also share any data models created that will help you manage your business moving forward.
- If there are gaps in your tracking, I will provide guidance on how to fix them.
- Perfect for businesses who have an unresolved but specific questions centered around strategic initiatives, such as customer valuations, sales incentive impact, or lead quality.
Example: CARD LIMITED, LLC


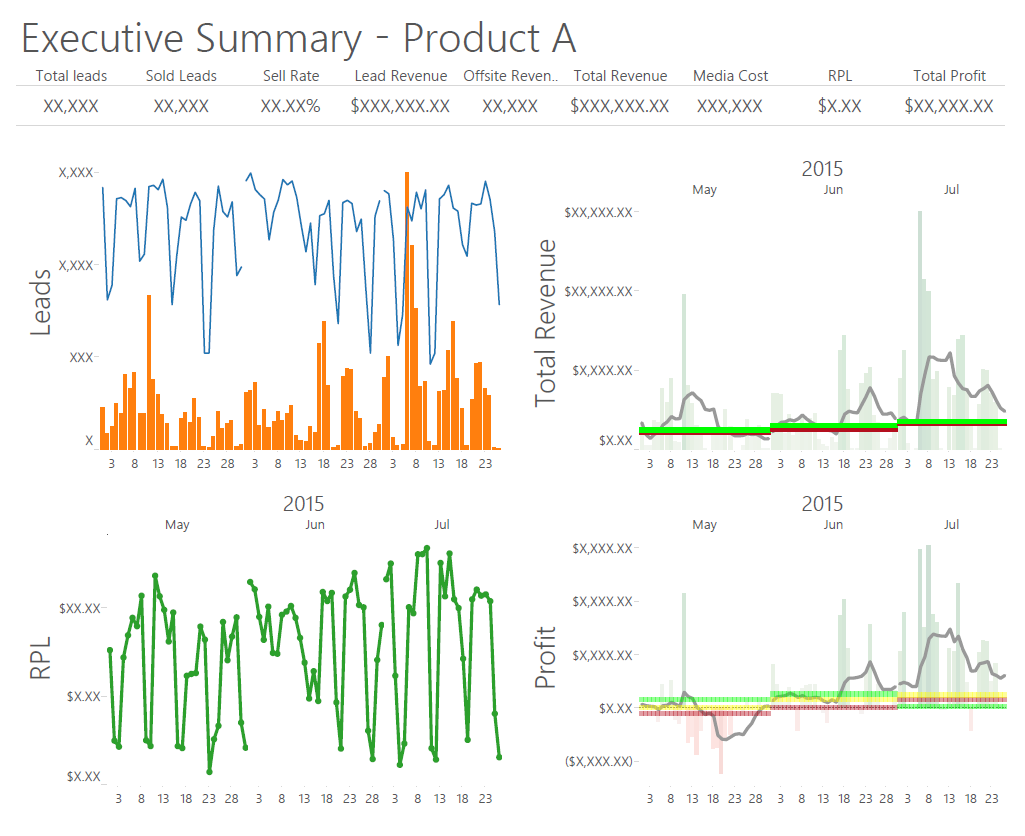
Data Visualization
You need a compelling visualization of your data to present to internal stakeholders or clients. Your goal is a straightforward, intuitive visual narrative that will help drive understanding and action.
- You will receive your data visualizations in PDF, JPEG, and Tableau Reader formats. If needed visualizations can be implemented directly into PowerPoint.
- Visualizations will be made to match your branding for a seamless presentation experience.
- You will also receive a 1-on-1 consultation to make sure you've got everything you need to deliver a powerful narrative.
- Perfect for businesses who need the power of a visualized data narrative to build consensus and drive action.

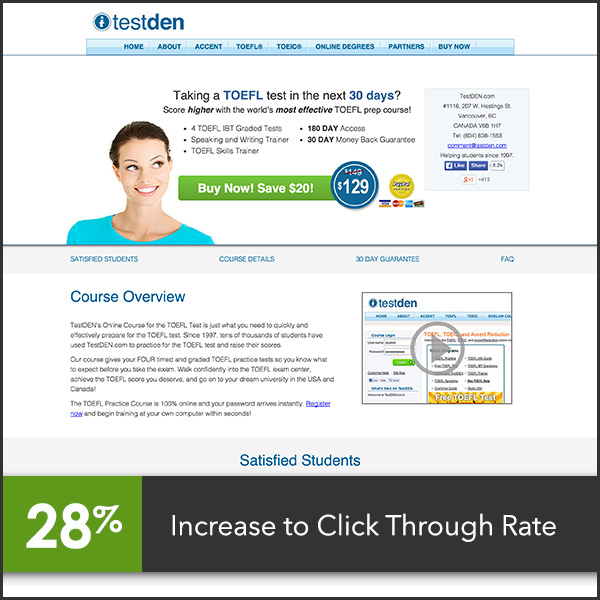
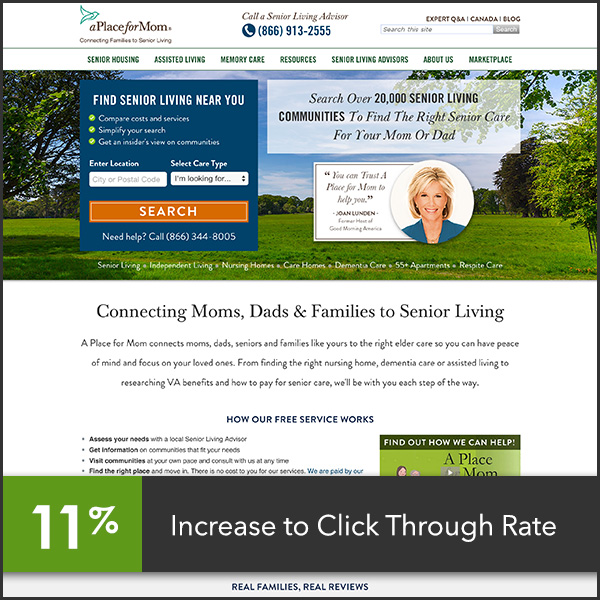
Conversion Rate Optimization
You use your website to drive leads, sales, or consumer engagement. Using a thorough methodology combing analytical research with proven design principles and rigorous testing we will increase you conversion rate.
Bannerfish Interactive partners with CRO Creative to provide Conversion Optimization services.
See more at CRO Creative.

On-Demand Analytics
You have your data, but you need more robust reporting and data visualization. We will work together to define your reporting needs, and then I will host your reports using Tableau Server. The reports will draw directly from your databases, providing up-to-date, direct, real-time analytics on demand.
- You will receive a login to your own hosted Tableau Server setup drawing reports in real-time from your databases.
- Dashboards will be built in direct consultation with you and your internal clients, making sure that your needs are met.
- Every dashboard deployment will come with a 1-on-1 consultation to help you maximize the value of the reports and dashboards created.
- New custom reports can be built and added to your Tableau Server setup on demand, providing a customized experience that grows and changes with your business.
Example: QuoteWizard, LLC